mini-siem-elk
🔗 Integrate Filebeat with ELK Stack
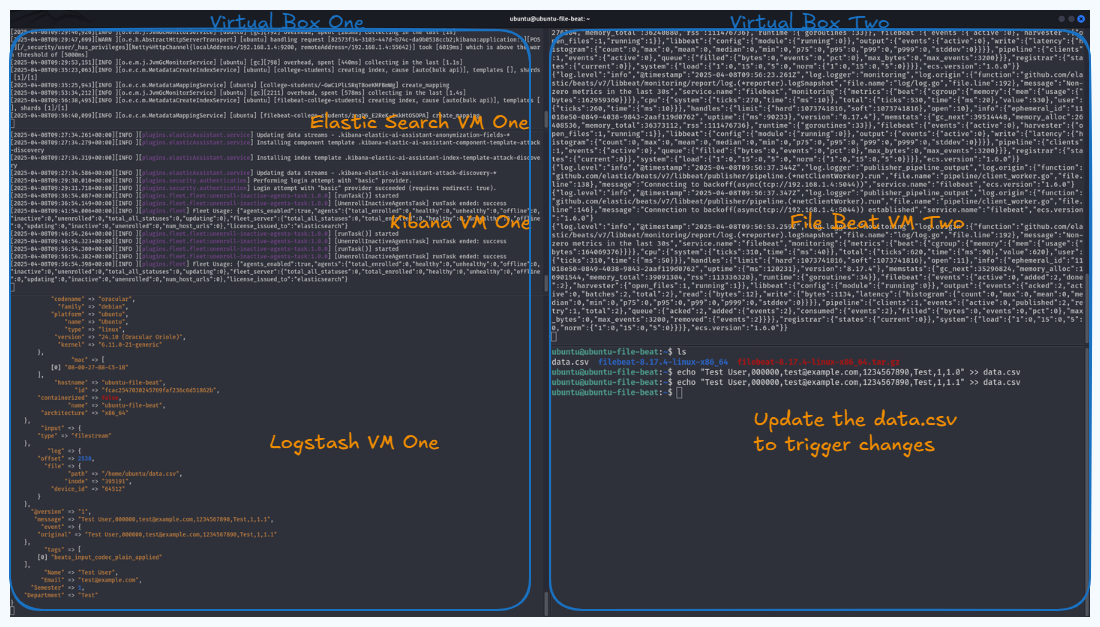
This guide walks through setting up Filebeat 8.17.4 on a separate Ubuntu VM to forward both CSV data and Apache web server logs into the ELK Stack.
💡 Ensure you have create a separate Ubuntu Server VM. You can refer to a YouTube tutorial if needed for VM setup.
🖥️ Filebeat Setup on a Separate Ubuntu VM
📥 1. Download and Extract Filebeat
curl -L -O https://artifacts.elastic.co/downloads/beats/filebeat/filebeat-8.17.4-linux-x86_64.tar.gz
tar xzvf filebeat-8.17.4-linux-x86_64.tar.gz
cd filebeat-8.17.4-linux-x86_64
⚙️ 2. Enable Logstash Output
Edit filebeat.yml:
output.logstash:
  hosts: ["192.168.1.4:5044"]
# Comment out the Elasticsearch output if enabled
# output.elasticsearch:
#   hosts: ["localhost:9200"]
✅ Make sure your Logstash instance is running and reachable. ✅ Make sure to update the IP address with you Logstash IP address.
🔍 3. Test Filebeat Configuration
./filebeat test config
🔗 4. Test Logstash Connectivity
./filebeat test output
📦 Send CSV Data from Filebeat to Logstash
✏️ 1. Enable Log Input in filebeat.yml
filebeat.inputs:
  - type: log
    enabled: true
    paths:
      - /path/to/data.csv
📌 Replace
/path/to/data.csvwith the actual path to your CSV file.
🚀 2. Start Filebeat
./filebeat -e
⚙️ Configure Logstash to Accept Filebeat Input
🛠️ 1. Update logstash.conf Input Block
input {
  beats {
    port => 5044
  }
}
🛠️ 2. Configure Output for CSV Data
output {
  elasticsearch {
    hosts => ["https://localhost:9200"]
    user => "elastic"
    password => "your_password"
    ssl_enabled => true
    ssl_verification_mode => "full"
    ssl_certificate_authorities => ["/path/to/http_ca.crt"]
    index => "filebeat-college-student"
  }

  stdout { codec => rubydebug }
}
🔐 Replace
/path/to/http_ca.crtand credentials as per your setup.
Restart Logstash to apply changes.
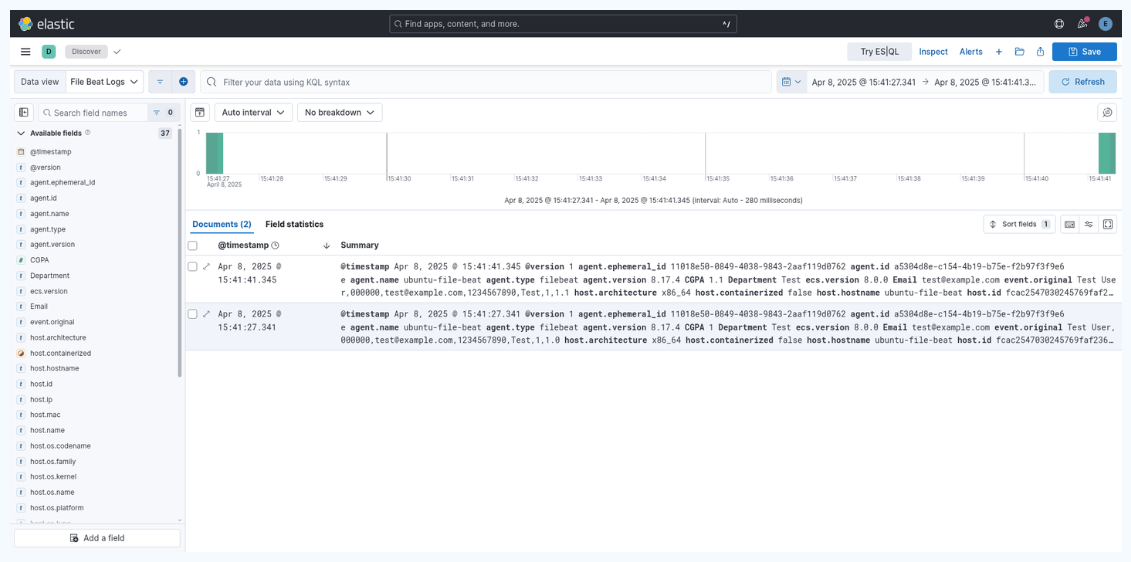
📊 Visualize CSV Data in Kibana
- Go to Stack Management > Data Views
- Create a new Data View with pattern:
filebeat-college-student - Navigate to Discover and view your data
🌐 Forward Apache Logs from Filebeat to ELK
🔁 1. Update Filebeat Input in filebeat.yml
filebeat.inputs:
  - type: log
    enabled: true
    paths:
      - /var/log/apache2/access.log
      - /var/log/apache2/error.log
    fields:
      log_type: apache

output.logstash:
  hosts: ["192.168.1.4:5044"]
💡 Ensure Apache logs are available at the specified paths. You may simulate traffic using a Python HTTP server if needed.
🧩 2. Update Logstash Pipeline for Apache Logs
input {
  beats {
    port => 5044
  }
}

filter {
  if [log_type] == "apache" {
    grok {
      match => { "message" => "%{COMBINEDAPACHELOG}" }
    }

    date {
      match => ["timestamp", "dd/MMM/yyyy:HH:mm:ss Z"]
    }

    geoip {
      source => "[source][address]"
      target => "[source][geo]"
    }

    if [user_agent] and [user_agent][original] {
      useragent {
        source => "[user_agent][original]"
      }
    }
  }
}

output {
  if [log_type] == "apache" {
    elasticsearch {
      hosts => ["https://localhost:9200"]
      user => "elastic"
      password => "your_password"
      ssl_enabled => true
      ssl_verification_mode => "full"
      ssl_certificate_authorities => ["/path/to/http_ca.crt"]
      index => "ubuntu-apache-webserver"
    }

    stdout { codec => rubydebug }
  }
}
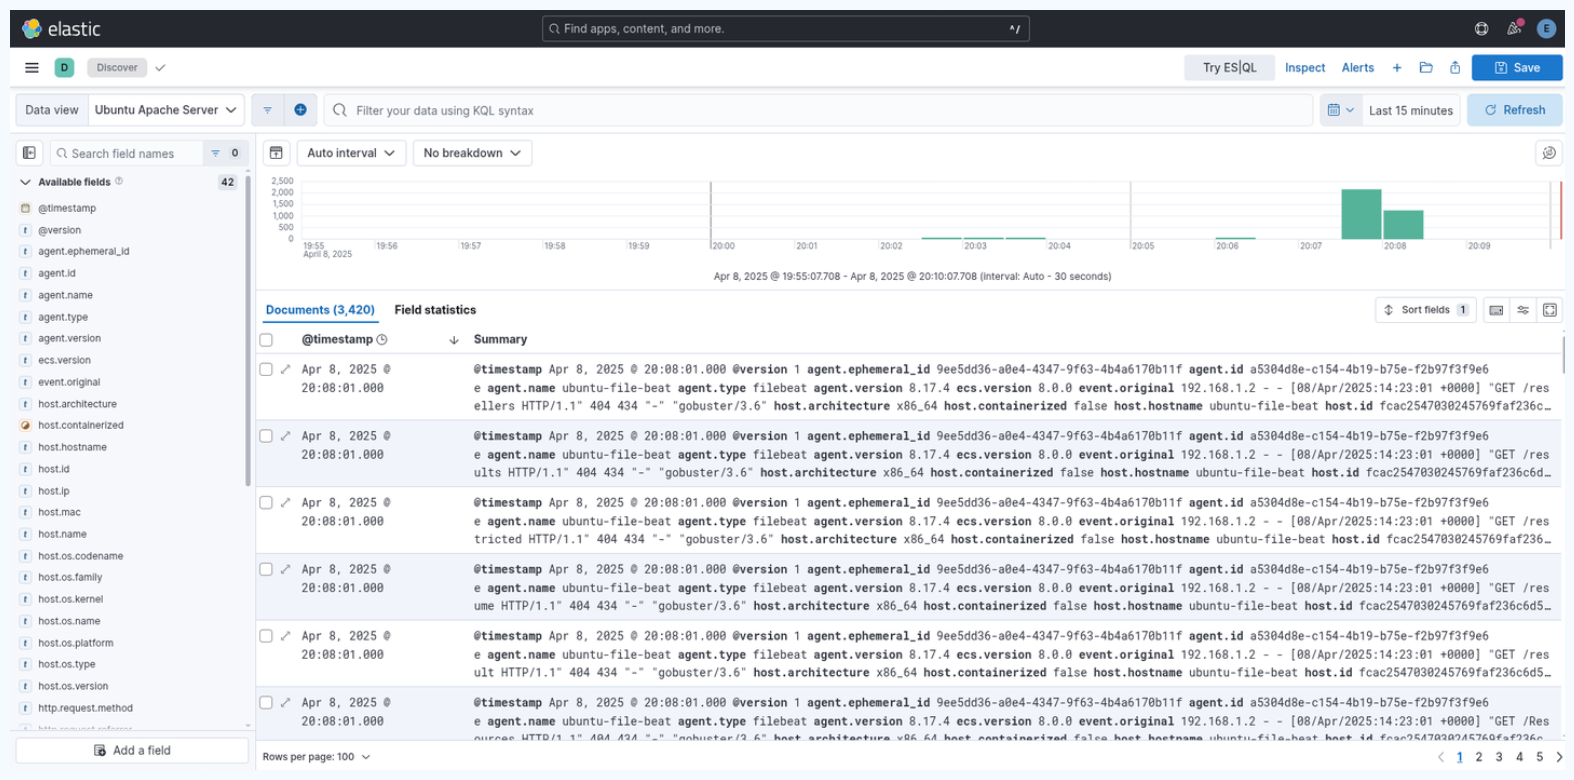
📈 3. View Apache Logs in Kibana
- Go to Stack Management > Data Views
- Create a Data View with pattern:
ubuntu-apache-webserver - Open Discover to explore logs
🗂️ Screenshot Directory
All referenced images in this guide should be stored at:
/images/04-integrate-filebeat